Performance & Results
School Performance Tables
For further information on our school results see our page on the Government's School and College Performance comparison website:
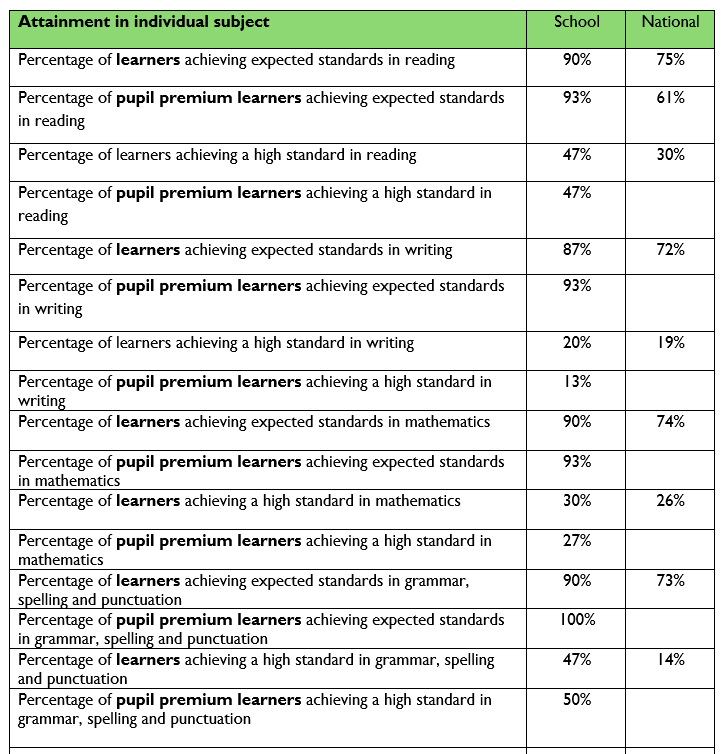
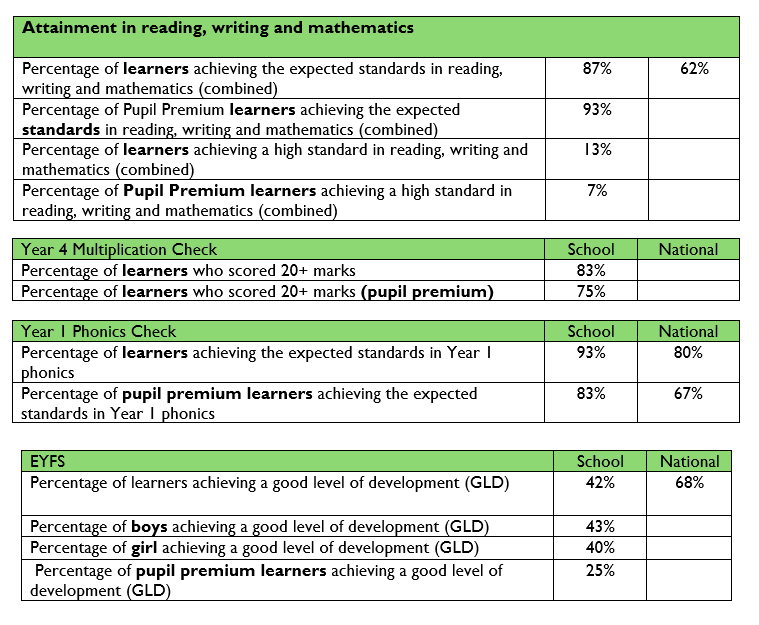
Our School Results 2024-2025
School Performance Tables
For further information on our school results see our page on the Government's School and College Performance comparison website: